The 2008 crash didn't arrive in one day. It travelled for 27 months before it reached the S&P 500, and you can watch it go.
October 9, 2007. The S&P 500 closes at 1,565. A record. It won't close higher again for five and a half years.
Here's the strange part. On that same day, the six big American homebuilders were already down 62% on average from their highs. The mortgage insurer Radian had lost 64%. And asset-backed commercial paper, short-term IOUs backed by pools of loans that banks' side vehicles renewed every few days or weeks, had shrunk by $283 billion in eight weeks.
A record and a crisis, on the same day. It depended on where you looked.
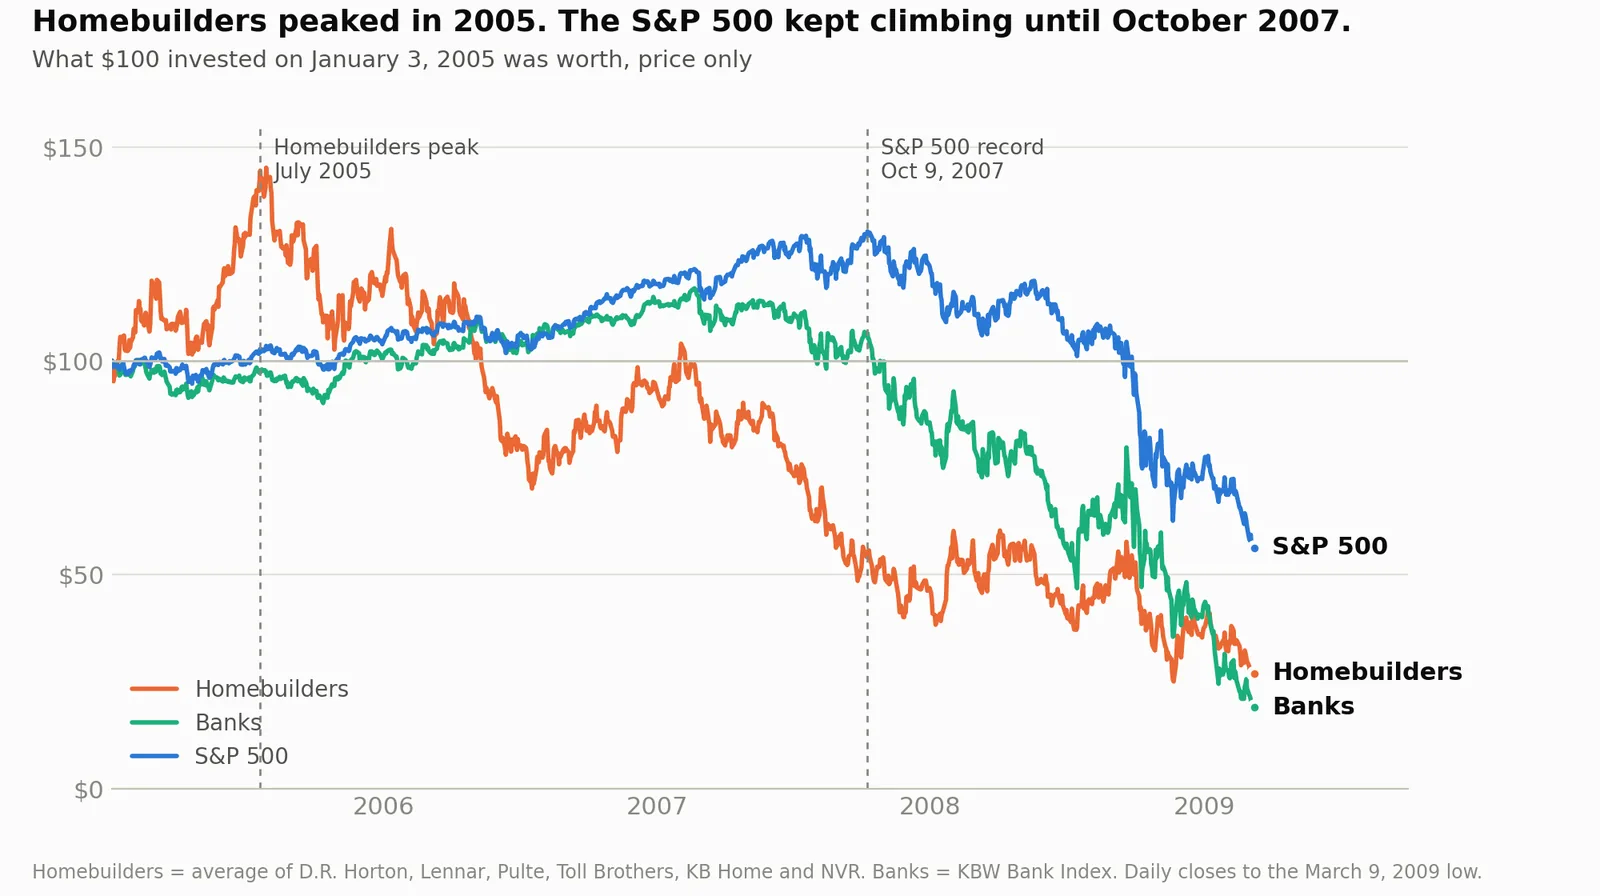
What $100 invested in January 2005 was worth: the homebuilders, the banks and the S&P 500.
The crash didn't happen on one day
We tell 2008 as one event. Housing crashed, the banks went with it, then Lehman. Clean.
Prices tell it differently. I pulled daily closing prices for 38 things: stocks, indexes, funds, oil, copper, gold. Before fetching a single price, though knowing how 2008 ended, I sorted them into ten groups by how close their business sat to an American home mortgage. Homebuilders first. Then mortgage lenders, insurers, investment banks, commercial banks, the financial sector as a whole, the big US indexes, consumer and industrial companies, foreign markets, and commodities last.
Then I asked one thing of each: between January 2002 and the crisis low in March 2009, when was your highest close? For some, Tokyo's Nikkei for one, that wasn't an all-time record. It was the top of this cycle.
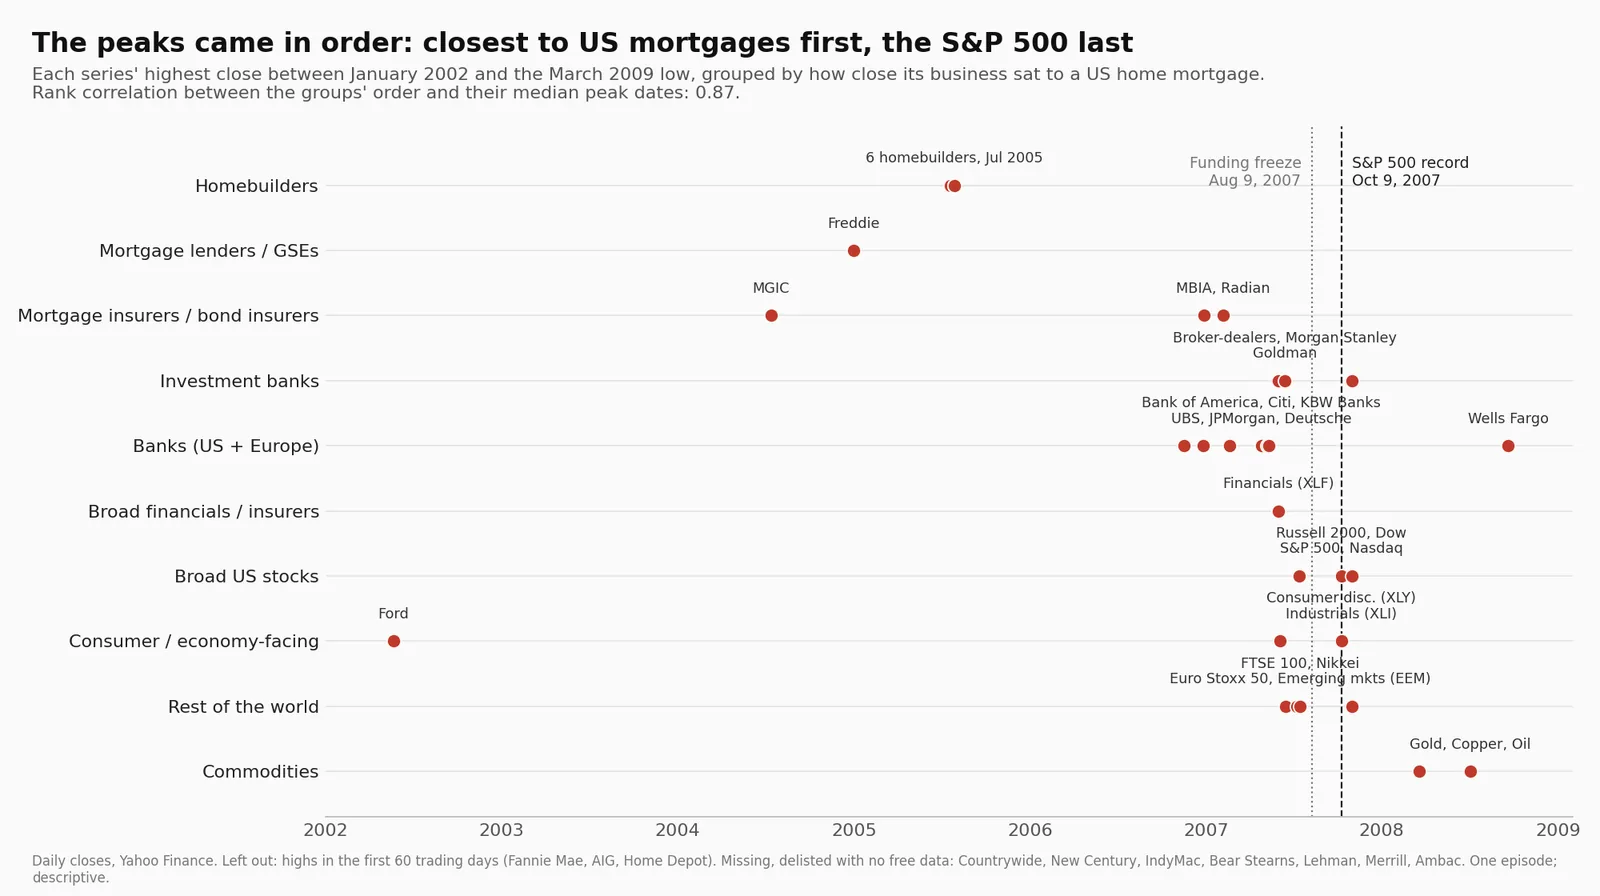
Each group's highest close between 2002 and the March 2009 low, grouped by how close it sat to US mortgages.
Here's what came back:
- July 2005. All six big homebuilders peak within eight days of each other. D.R. Horton, Toll Brothers, KB Home, Lennar, Pulte, NVR. The Case-Shiller national house price index won't peak for another year.
- November 2006 to February 2007. Bank of America, Citigroup, the bond insurer MBIA, Radian, the main bank index.
- Spring 2007. UBS, JPMorgan, Deutsche Bank.
- June 2007. The index of Wall Street brokers and the financial sector as a whole.
- June and July 2007. London, Tokyo, Europe, US small caps.
- October 9, 2007. The S&P 500 and the Dow.
- July 2008. Copper and oil.
Not a crash. A wave. It started in one corner of the economy and rolled outward, one layer at a time, for 27 months before it reached the index on the evening news.
Is the order real, or am I seeing faces in clouds?
Fair question.
So I put a number on it. Each group's date is the middle (median) of its members' highs. Rank the ten groups from closest to mortgages (1) to farthest (10), and compare that ranking with the order in which they peaked. A perfect match scores 1. No relationship scores about 0. This one scores 0.87.
Then I shuffled the group labels at random, 200,000 times, to see how often luck alone produces an order that neat. About once in a thousand tries.
One warning. I picked those groups knowing how 2008 ended. The shuffle says the pattern is unusual. It can't say how obvious it would have looked to someone in 2006. Nobody gets that test after the fact.
And some things don't fit. Freddie Mac and the mortgage insurer MGIC topped out in 2004, before the homebuilders. The broker index peaked on June 1, 2007, but Goldman Sachs, the broker everyone knows, kept rising until October 31. Wells Fargo's high came on September 19, 2008, the day a ban on short selling financial stocks took effect. And some of the companies closest to the fire aren't in my data at all: Lehman and New Century went bankrupt, Countrywide and Bear Stearns were swallowed in rescue deals, and the free price source I used drops companies that no longer trade. I don't know where they'd land.
Meanwhile, in the plumbing
The wave reached the real danger zone in August 2007.
A lot of mortgage bonds were paid for with short-term borrowing that had to be renewed every few days or weeks. Most buyers treated that paper as nearly as safe as cash, and few dug into what was behind it. Then subprime losses started showing up, and nobody could tell which bonds were the bad ones. So the buyers refused to renew.
On August 9, the French bank BNP Paribas froze three funds, blaming "the complete evaporation of liquidity." Within weeks, about a third of the programs that issued asset-backed commercial paper were facing a run, according to Federal Reserve economists. In September, savers queued outside Northern Rock branches across Britain, in what was widely called the country's first bank run since 1866.
And the S&P 500? It went up 4.5% between August 8 and October 9.
Why the index didn't notice
Because the S&P 500 isn't a mortgage index. It's a basket of 500 companies weighted by size, and in 2007 many of the big ones were doing great.
From August 8 to October 9, the S&P energy sector fund rose 9%. Materials 8%. Tech 6%. Oil and metals were booming, the dollar was down about 6% since January, and none of that had much to do with somebody's adjustable-rate loan in Phoenix. Financial stocks barely moved, up 3% and still 6% below their June high. Energy, materials and tech rising much faster was enough to lift the whole index. For a while.
Two of the gauges people trust most made things look calmer than they were.
The VIX, Wall Street's fear gauge, spiked to about 31 in mid-August, then eased back to 16 by the record. Still above the 11 it showed early in the year, but nowhere near panic.
And the yield curve, the most famous recession warning there is, flipped back to "normal" in August. Sounds like good news. It wasn't. Scared investors piled into three-month Treasury bills and pushed their yield down. The curve looked healthier because people were panicking.
The one strange day
There was one statistically extreme day on the stock screen, seven months before the peak.
On February 27, 2007, the S&P 500 dropped 3.5%. It was set off mainly by an almost 9% one-day fall in Shanghai and fresh talk of a US recession, not by mortgages. But look at the size. The night before, the VIX sat at 11. At that level options were pricing daily swings of about 0.7%. The market moved five times that.
I checked every trading day from December 1998 to October 2026, using the previous day's VIX each time. About 7,000 days. That's the only one where the market moved more than four and a half times what options were pricing.
By mid-April the index was back above where it started that day. On May 30 it passed its old dot-com record. And on it went.
Nobody acted like they knew
This is the part that keeps me honest.
Look at the chart and it all seems obvious. Most of the people inside the system didn't behave as if it was. Bank CEOs kept their own shares going into the crisis and lost fortunes on them. Mid-level people at the firms packaging mortgages bought houses for themselves near the top. In March 2007, Fed Chairman Ben Bernanke told Congress that the damage from subprime to the broader economy and financial markets "seems likely to be contained."
A few did see it. Goldman Sachs started cutting its mortgage bets in December 2006, after ten straight days of losses on its mortgage desk. A handful of investors bet against subprime bonds and got rich. They were the exception.
Some prices turned early. No single price told the whole story. You only see it when you line them up by date.
What I'm not saying
I'm not saying you could have called the top. Every date on that chart is clear now. Living through it, it was a mess of mixed signals, and plenty of famous warnings since then have been flat wrong. The 10-year minus 3-month Treasury curve was inverted on every trading day of 2023 and on most days of 2024. In January 2024, with that curve still inverted by more than a full point, the S&P 500 broke its old record and kept climbing.
I'm also not saying 2008 proves a law. It's one episode.
What's next
Next I'll run the same test on other crashes, with the rules written down first. If crises travel outward from where the trouble starts, the order should show up again: internet and telecom stocks first in 2000, property and the savings-and-loan banks in 1990, the long-dated growth stocks that rising rates hurt first in 2022.
2020 is the control. A virus hit most of the market within weeks. That's not a slow spread from one corner over years, so a 2008-style wave shouldn't appear. (I haven't looked at the 2020 sector data yet, on purpose.)
If the wave shows up where the trouble started and fades in 2020, that's something real. If it only shows up in 2008, I'll tell you that too.
Sources: daily prices from Yahoo Finance; the VIX, interbank spreads, Treasury yields and commercial paper from the St. Louis Fed's FRED database; house prices from the S&P CoreLogic Case-Shiller index. Research: Gorton & Metrick (2012) and Covitz, Liang & Suarez (2013) on the run on short-term funding; Fahlenbrach & Stulz (2011) on bank CEOs' shareholdings; Cheng, Raina & Xiong (2014) on securitisation staff buying homes; the Financial Crisis Inquiry Commission report (2011) on Goldman Sachs; Bernanke's testimony to the Joint Economic Committee, March 28, 2007; the UK House of Commons Treasury Committee report on Northern Rock (2008). Not investment advice.
Keywords: macro, 2008 financial crisis, housing bubble, S&P 500, market history.