In 2024 a crowded yen trade turned a small Tokyo rate hike and one weak US jobs report into the worst day for Japanese stocks since 1987. The trade unwound in two weeks and has since been rebuilt. The same sequence is lining up again, this time with $40 trillion of US federal debt behind it.
The 2024 version ran on a clock. On July 11 Japan intervened in the currency market to stop the yen from falling. On July 31 the Bank of Japan raised its policy rate from 0.10% to 0.25%, and Governor Ueda said more was coming. On Friday August 2 the US jobs report came in soft, with unemployment at 4.3%, which tripped the Sahm rule. On Monday August 5 the Nikkei fell 12.4%, its worst session since 1987. The S&P 500 lost 3%. The VIX touched 65 intraday, a level it had only reached in 2008 and in March 2020. It closed at 38.6, which tells you how much of the panic was mechanical.
Fifteen basis points did not do that on their own. The hike primed a very crowded position and the US data set it off. The trigger was ordinary. The size of the reaction came from the structure.
Two years later the structure is back, and the debt underneath it is much larger. The dates are at the end.
What the trade is, and what it pays now
Japan held rates near zero for most of thirty years, and the world built a habit on top of that. Borrow yen for almost nothing, convert to dollars, buy anything with a yield: Treasuries, the S&P, credit, crypto. Keep the spread. Add leverage. Repeat.
In 2024 the spread was about five percentage points. Today it is thinner. The Bank of Japan is at 1.0%, its highest rate since 1995, and the Fed is at 3.50 to 3.75%. Call it two and a half points. That spread is the whole reason the trade exists, and both central banks get to move it in the same week this month.
How big is the position? Estimates span an order of magnitude, and that range is a warning in itself. The measurable slice, yen borrowing visible in bank data, runs in the hundreds of billions. At the other end, Deutsche Bank has called Japan's entire public-sector balance sheet, about $20 trillion, one giant carry trade. That is a framing, not a count of speculative borrowing, but it shows how deep the yen-funding habit goes. Nobody sees the whole book. That has been true before every leveraged accident I can think of.
It unwound. Then it came back.
The common line about 2024 is that the carry trade never really unwound. The CFTC data says otherwise.
Speculators held a record short yen position of about 180,000 contracts in July 2024. Within two weeks of the crash they were net long. The stampede happened, all the way through.
Then the position was rebuilt. Through 2025 and into 2026 the shorts came back, and as of early September 2026 net yen shorts are around 92,000 contracts, about half the 2024 peak, and growing week by week. The people who got run over went back in, because the spread still pays and because the last crash turned out to be survivable. That second reason is the one that sets up the next crash.
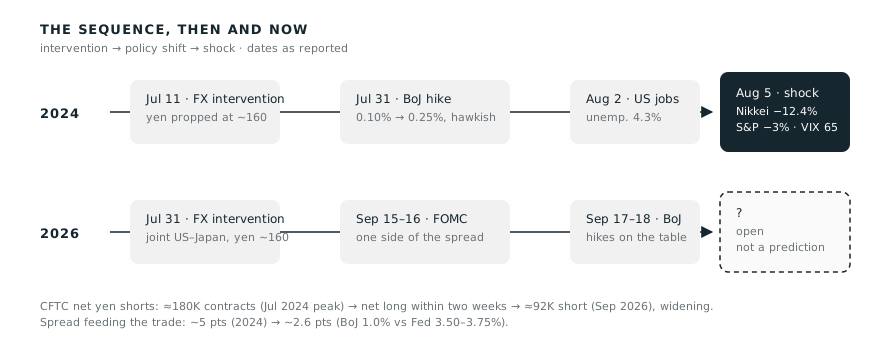
Fig. 1. The sequence that produced August 5, 2024, and the 2026 calendar so far. The parallel is structural, not a prediction. The third box in the second row is still open.
Why the exit is violent
The mechanics have not changed. To get out, a fund buys back yen. That strengthens the yen, which deepens the losses of everyone still short, which forces more of them out. One fund leaving is a transaction. A crowd leaving is a stampede through a door that gets narrower the more people run at it. In this trade the safest position is the earliest exit. That is why the 2024 move was so far out of proportion to its trigger, and why the next one will not need a big trigger either.
The debt underneath it
The equity crash is what people remember from 2024. The debt is what makes 2026 heavier.
US federal debt passed $40 trillion in August 2026, up a trillion in five months. To be precise about that number: it is total public debt outstanding. About $32 trillion of it is debt held by the public, the part that investors actually own and trade. The rest sits in government trust funds. Either way, Washington now pays over $1.1 trillion a year in interest, more than it spends on defense, and a government issuing at that pace needs a deep bid for its bonds every single week. The price of money is set by the marginal buyer.
Japan is the largest foreign holder of Treasuries, at about $1.19 trillion. And for the first time in a generation, Japanese institutions have a reason to stay home. The 30-year Japanese government bond cleared auction above 4% on September 3, 2026, against domestic inflation of around 3%. A Japanese life insurer can now earn a real return without shipping capital across the Pacific.
Two cautions, because this is where the scary version of the story usually overreaches. First, these are different people from the carry speculators. Pensions and insurers own yen rather than borrow it, and a BoJ policy hike does not squeeze them. What pulls them home is the long end of the JGB curve, and that is driven by Japan's own fiscal picture. Second, the repatriation is a drip, not a cliff. Sell-side consensus is a 5 to 12% reduction over two to three years, and Japan's Treasury holdings actually rose into 2026. But a drip at the margin of a $32 trillion market still moves the price of money. Two independent pressures, one speculative and one institutional, are rising in the same window for different reasons. They do not share a trigger. They share a month.
The calendar
2024 went: intervention on July 11, hike on July 31, shock on August 2 to 5.
2026 so far: the US and Japan jointly intervened to support the yen on July 31, after it hit 160 in June. The Fed meets September 15 to 16 and decides one side of the spread. The Bank of Japan meets September 17 to 18 and decides the other. Ueda has said a hike is on the table at every meeting, including this one. Markets price the next step to 1.25% by December. The bigger risk is not any one telegraphed hike but a change of pace, from a hike every half-year to one every quarter. Every quarter point closes the spread that 92,000 contracts of rebuilt shorts are standing on.
Intervention has happened. Two central banks meet back to back next week. The third box is open.
The other side
I do not trust pieces that only try to scare me, so here is the case against. The BoJ's gradualism is deliberate and loudly communicated. It watched August 2024 from the inside and has every reason to defuse rather than detonate. A good share of the measured positions are hedged or short-dated. The biggest size estimates mix public balance sheets with speculative borrowing. Authorities intervened in July and will again. Japanese repatriation is slow by consensus and by design. And 2024 itself showed the system can absorb a historic shock in days.
All of that is true. None of it removes the structure. It argues about how much pressure the trigger needs, not about whether the trigger is there.
What I watch
The pace of BoJ hikes, not the level. The Fed's side of the spread, decided two days earlier. Yen implied volatility, which is the market pricing its own unwind risk. CFTC yen positioning, where the rebuild shows up every Friday. And the 30-year JGB yield: the longer it holds above 4%, the stronger the pull on Japanese capital away from a Treasury market that has never needed it more.
August 2024 got explained in an afternoon and filed as an event that ended. It was a mechanism showing itself at full speed. The position that produced it is back at half strength and growing. The spread it lives on is being squeezed from Tokyo. There is $40 trillion of federal debt behind it. And the sequence that came before the last accident is two boxes into a three-box row.
Japan is the watch point. It has been all along.
Research commentary on public market mechanics. Not investment advice, not a prediction, and nothing here is a recommendation to buy, sell, or hold anything.
Sources
- BoJ hike to 0.25% (July 31, 2024), Aug 5 2024 moves (Nikkei −12.4%, S&P −3%, VIX 65 intraday / 38.6 close): contemporaneous reporting, Reuters/Bloomberg/CNBC
- BoJ at 1.0%, highest since 1995 (June 2026) — CNBC
- BoJ governor: hikes on the table at every meeting, incl. Sept 17–18 — Nikkei Asia
- 30-year JGB auction clears above 4% (Sept 3, 2026) — Bloomberg · yield history — Trading Economics
- CFTC yen net shorts ≈ −92K contracts (Sept 2026) — FX.co · carry-trade rebuild commentary — FXStreet
- Fed on hold at 3.50–3.75% — Schwab · FOMC minutes, July 2026 — Federal Reserve
- Joint US–Japan yen intervention, July 31, 2026 — exchangerates.org.uk · yen surge on BoJ bets — CNBC
- US gross debt passes $40T (Aug 2026) — Bloomberg · gross debt vs. ~$32T held by the public — CRFB · $1.1T interest > defense — Al Jazeera
- Deutsche Bank: Japan's public sector as a $20T carry trade — MarketScreener
- Japan Treasury holdings ≈ $1.19T, repatriation consensus 5–12% over 2–3 yrs — TMS Capital · FRED series
Keywords: macro, yen carry trade, Bank of Japan, Treasuries, market structure.