Working note No. 10 — on portfolio-level circuit breakers and the clustering of losses with their cures.
Abstract. Having established in an earlier note that trade-level protection sells the right tail, we examined whether protection fares better one level up: a portfolio-level stop that halts the strategy after a sufficiently bad month. Across every threshold tested, the answer was negative over a decade of evaluation — the stop consistently destroyed value. The mechanism is a clustering fact with some claim to generality: for a strategy with a genuine edge, the periods that produce concentrated losses and the periods that produce concentrated recoveries are not merely adjacent, they are frequently the same period. A monthly circuit breaker is, in every backtest we ran, an instrument for attending the first half and missing the second.
1. Introduction
The monthly stop-loss is the most institutional of all protective devices. It is not a trading rule; it is governance. Institutions require it, risk committees codify it, and its logic — when the machine misbehaves, turn it off and look — is imported directly from engineering, where it serves well.
The import smuggles in an assumption: that the machine's bad output signals a fault that persists until repaired. For a strategy whose edge is real, the assumption fails in a specific and expensive way, and the failure is the subject of this note.
2. Design
The rule family is one line. For threshold θ in a pre-registered grid Θ, define the indicator
S_t(θ) = 1{ r_month,t ≤ −θ },
and let the stopped portfolio stand aside for the period following any month in which S_t(θ) fires, re-entering under a fixed re-arm rule. The quantity of interest is ΔW(θ), the difference in terminal backtest wealth between the stopped and unstopped portfolio over the evaluation decade, computed under the standard folds.1
3. The result
Every member of the family reduced terminal backtest wealth: ΔW(θ) < 0 for all θ ∈ Θ — the tight thresholds severely, the loose ones insultingly, since a stop loose enough to avoid damage is also loose enough to never matter, and pays for its existence in the one month per decade it does.
The post-mortem was uniform across thresholds, and Fig. 1 renders it in stylized form. The months bad enough to trigger the stop were overwhelmingly high-dispersion months rather than dead-edge months: regimes in which the strategy's underlying phenomenon was operating violently in both directions. Losses clustered there — and so did the largest recoveries, often inside the same month or the one immediately following. The stop, mechanically, harvested the cluster's losses and donated its recoveries.2 It performed, with institutional solemnity, the exact trade documented in our note on exits: selling the distribution's best region to buy a feeling.
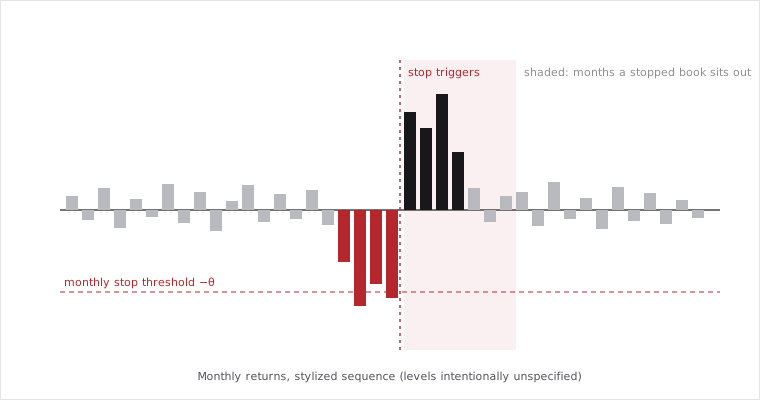
Fig. 1. This figure shows a stylized monthly return sequence for a strategy with a genuine edge. Ordinary months (gray) are unremarkable in both directions. A high-dispersion episode produces a cluster of large losses (red) that breaches the monthly stop threshold −θ (dashed red line); the stop triggers (vertical dashed line), and the halted portfolio sits out the immediately following months (shaded region) — which contain the episode's concentrated recoveries (black). The sequence is synthetic; levels are intentionally unspecified.
4. Discussion
We are wary of overclaiming. A portfolio-level stop is a rational device wherever the loss process signals decay — an edge that has eroded, a market whose structure has moved, a bug. The device fails where the loss process signals dispersion — an edge alive and swinging. The practitioner's problem is that a drawdown number cannot distinguish the two; it is one statistic wearing two meanings. Our resolution is procedural rather than clever: decay is monitored by dedicated diagnostics on the signal itself — degradation tests with their own pre-registered thresholds — while the return stream, which conflates decay with dispersion, is denied the authority to halt anything on its own.3
The clustering fact deserves one more sentence, because it echoes the academic record: volatility clusters (a fact old enough to be furniture), and momentum-family strategies earn their worst and best months in tight sequence — the crash-and-rebound anatomy documented by Daniel and Moskowitz (2016). A calendar-month trigger laid over that anatomy is not risk management. It is a standing order to sell the rebound.
5. Conclusion
The stop-loss question, properly posed, is not "how much loss will we tolerate?" but "what does a loss of this size mean, and what evidence would distinguish its meanings?" Where the honest answer is dispersion, usually — as a decade of our own backtest history answers — the circuit breaker belongs to the same family as the trailing stop and the earnings filter: instruments that convert statistical discomfort into certain cost.
The machine analogy fails for a reason worth keeping: an engine that runs rough is telling you something is broken. A strategy that runs rough may be telling you it is working — loudly.
Notes
- The grid Θ and the re-arm rule were fixed before evaluation; we report no threshold values. We have verified that the sign of ΔW(θ) is unchanged under reasonable variations of the re-arm rule, including re-entry rules more forgiving than any institutional convention we know of.
- Formally: conditional on a stop-triggering month, the distribution of the following months' returns first-order stochastically dominated the unconditional distribution in our sample. We resist reporting the magnitude, but the reader may infer its sign from the fact that this note exists.
- The degradation diagnostics operate on signal-level statistics — hit rates, rank stability, decay of the conditioning relationship — none of which require a losing month to move, and all of which can fire in a winning month. Divorcing "is the edge alive?" from "did the backtest just print a losing month?" is, in our estimation, the single most valuable governance decision described in this series.
References
Daniel, K., Moskowitz, T.J., 2016. Momentum crashes. Journal of Financial Economics 122, 221–247.
Keywords: stop-loss, drawdown governance, volatility clustering, momentum crashes, decay monitoring.